Enrico Galati
UX/UI Designer
Technology becomes simple when you start from people.
How I workUX designer with UI skills, specialised in early-stage product exploration, idea validation and iterative design. I can run the whole process on my own, from research to prototype, and I have worked on automotive interfaces, enterprise dashboards and psychological-support tools for both mobile and web.
- ECHA, Helsinki — Product Management2026
- POLI.design — UX and UI Design2025
- Suor Orsola — Psychology, cognitive ergonomics, 110/110 cum laude2024
- Re:Lab — Interaction Engineering, automotive HMI2023
Work
With U
Product designWith U is a self-monitoring app for people in treatment for depression. Every day you say how you feel, write a few lines and put a stamp in your passport. The one answering the journal is Carota, an AI guide with clear limits: the chat is capped, and the therapist is always one tap away. I did the UX and the UI, from the flows to the interface, and wrote the front-end code.
ADHD: All Deeds
Are Done
UX/UI design
With too many things to do, a person with ADHD can freeze, and a classic to-do list fails. Here the things to do are a deck of cards: you draw one at a time without knowing which will come up, swipe right to do it, left to discard it, and the last card has to be done. I designed it end to end in Figma: user flows, wireframes, high-fidelity UI and an interactive prototype.
IUCLID
UX researchVersion 6 brought IUCLID far enough to carry real improvements. To find out which ones, ECHA chose to start from the people who use it. I planned and ran the consultation: 154 responses on EU Survey and 29 interviews across national authorities, industry, technical experts, EU and OECD partners and ECHA’s own staff, anonymised by hand for GDPR. In Power BI I cross-referenced the survey figures with the ones drawn from the interviews.
TripLoop
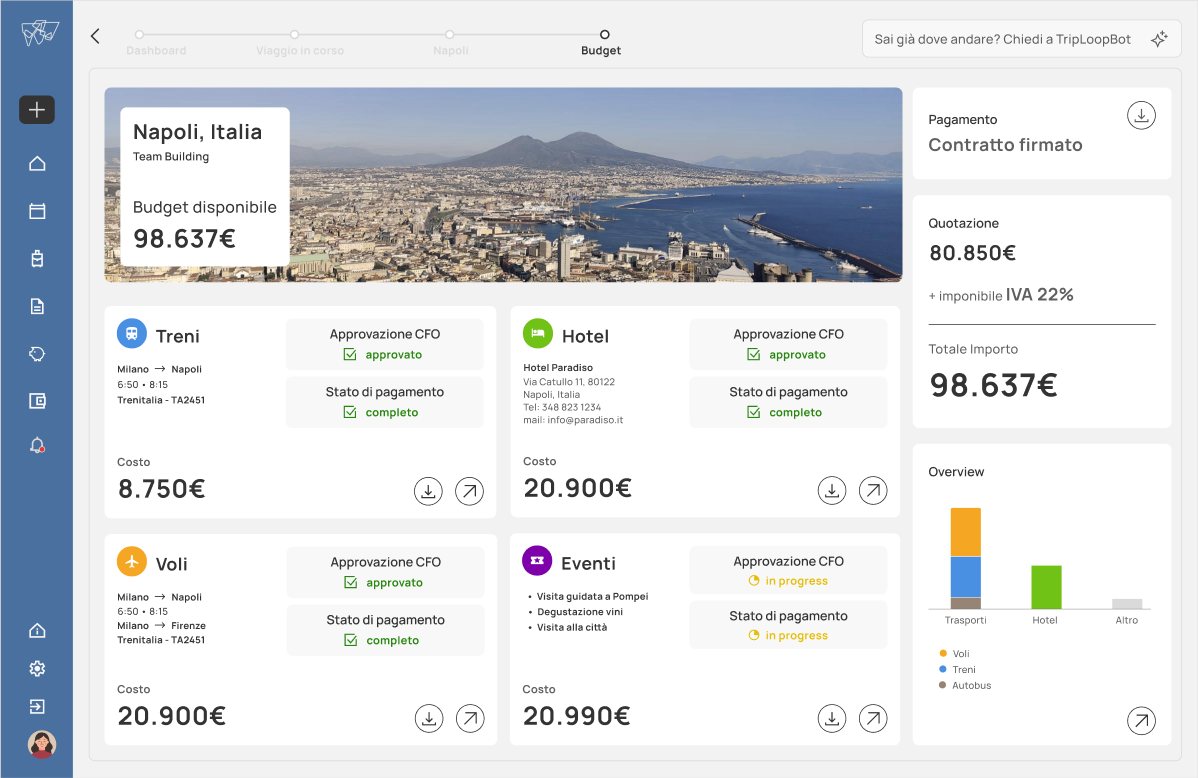
UI designTripLoop brings bookings, budget, transport and disruptions for business travel into one place. Another group on the master’s course had designed the UX; the three of us designed the interface like a station, in the colours of the Swiss metro. I looked after the colour, the micro-animations and the ticket card: whole for upcoming trips, torn for archived ones. In the eye-tracking test the gaze followed the order we had planned.
Alidays
for Creators
UX design
I thought a tour operator and a travel creator had nothing in common. I led the research, from netnography to interviews, and it proved me wrong: both sell the credibility of someone who promises a trip will be memorable. The platform comes from there. The creator proposes a trip, builds it with Alidays asynchronously and tries it in person; then the package goes online and their followers book it.
IUCLID
UX researchI planned and ran the consultation with the people who use IUCLID: six months, from the questions to the findings.
IUCLID is the database the European Chemicals Agency uses for regulatory dossiers. Version 6 brought it to a maturity where real improvements can be built on top, and that is where the consultation comes from: finding where it can grow, starting from the work people actually do. On the other side of the table were national authorities, industry, technical experts, EU and OECD partners and ECHA’s own staff. Remote interviews, in English, from twenty minutes to an hour.
The survey and the interviews were both needed.
People answer a questionnaire one way and describe their own work another way. The questionnaire measures where IUCLID stands today, the interviews bring out what is missing for the people who open it every morning. The survey ran on EU Survey. I wrote the interview guide, the questionnaire and the supporting material.
I anonymised every interview by hand, one at a time.
Transcripts from Teams, manual anonymisation for GDPR, then content analysis and thematic analysis. AI proposed the patterns, I checked them against the transcripts: on anonymised data only, and never through a platform without consent. In Power BI I built a star schema that cross-references the survey figures with the ones drawn from the interviews. Before ECHA I had never opened Power BI.
The hardest part was the calendar.
Every interview needed a colleague alongside me for the technical questions I could not answer, and their diaries changed the plan every week. The second difficulty was running the interviews naturally. At first they were not. I learned to handle both one-to-one and group sessions.
A job planned until the end of October, finished by the end of August.
This was not part of my research. 24 languages, over 500 phrases each to reformat by hand into a template. I proposed handing them to AI: one day tuning the prompt, 83% accuracy, three days of human correction. The AI could not write a slash, so I used XQX as a placeholder, a sequence that does not exist in any of the 24 languages.
The findings come out in the official report and will guide IUCLID’s development.
I presented the work to the team and it landed well. On the content of the research, until publication, I cannot say more.
“He successfully planned and managed this complex project, engaging with a wide range of stakeholders.”
Mark Roberts, Regulatory Officer, ECHA · my team leaderTripLoop
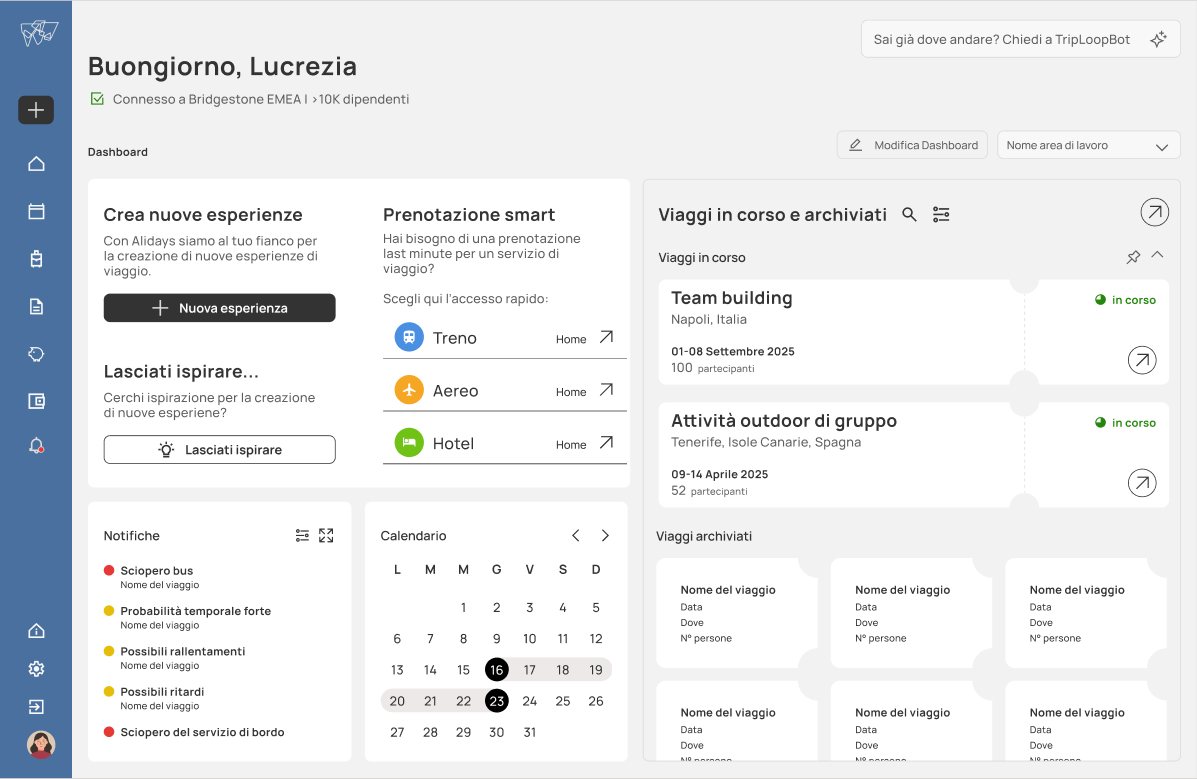
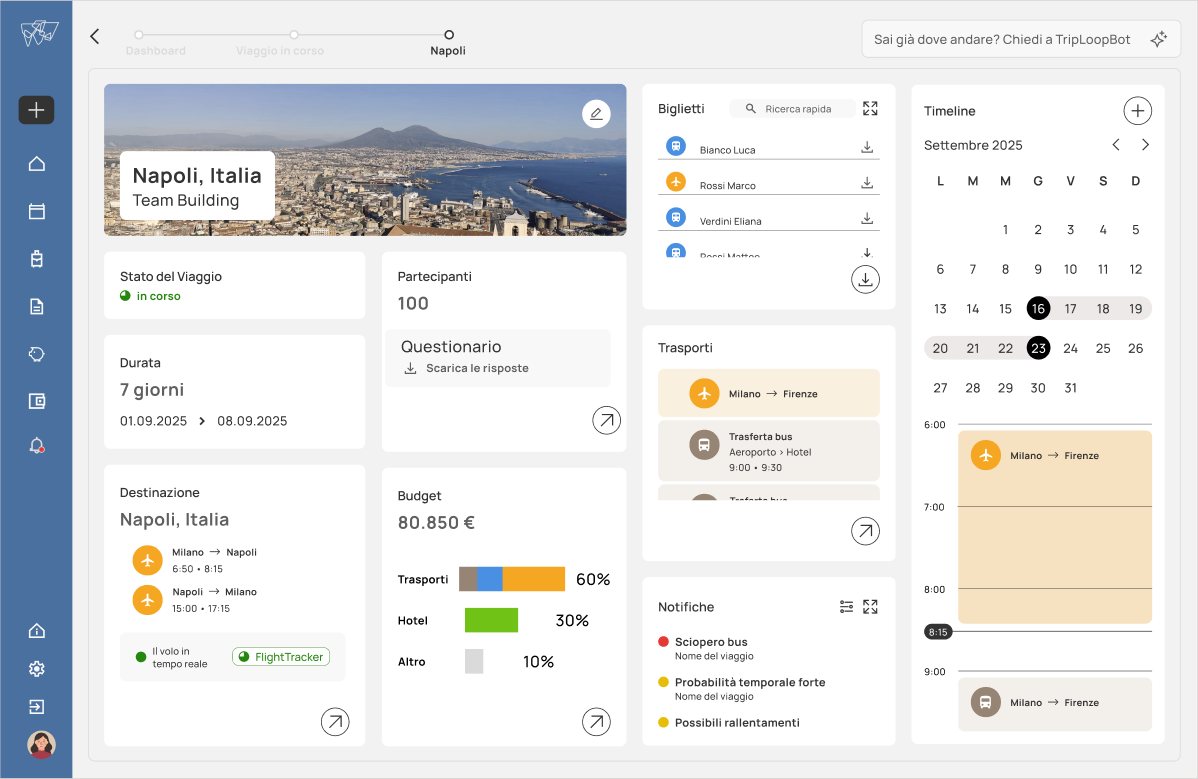
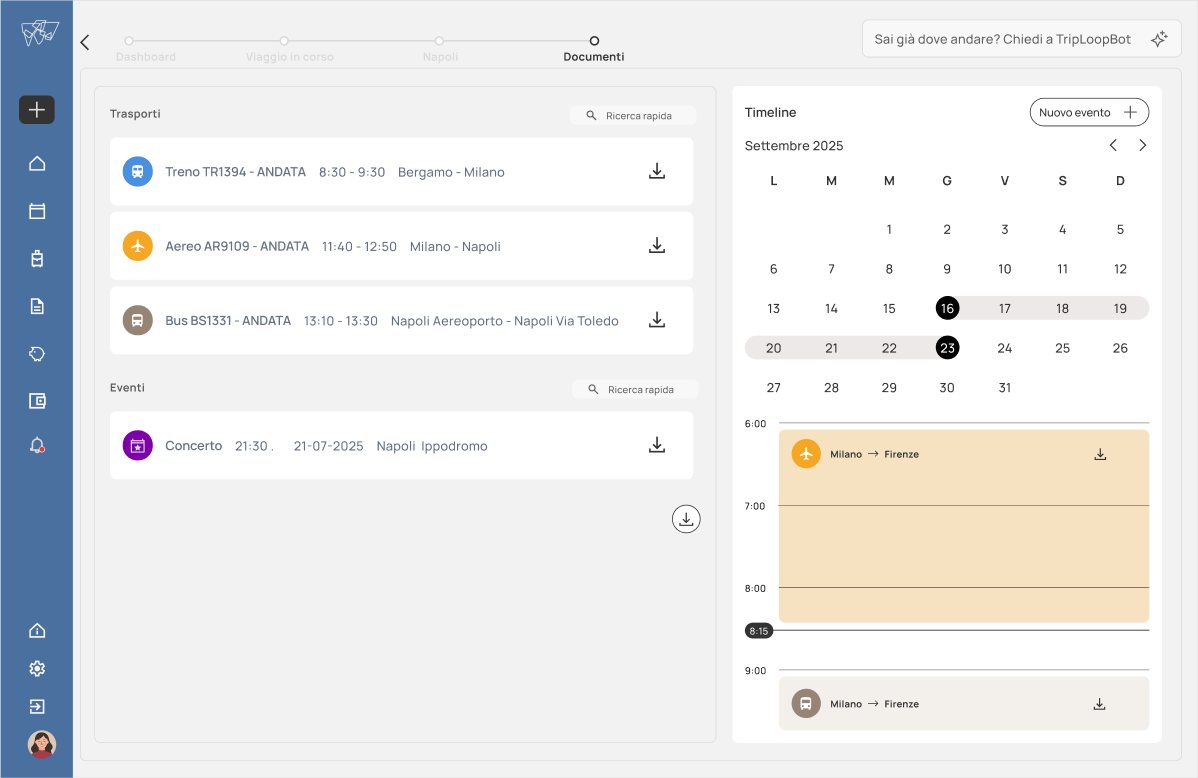
UI designUI for a business-travel platform: bookings, budget, transport and disruptions in one place. We designed it like a station.
Another group on the master’s course had designed the UX, again on an Alidays brief, so the research was not ours. The three of us designed the interface. Alidays and the tutors rated the work well.
Four services, four colours.
The four colours come from the Swiss metro. Swiss Style uses bright tones you can read from a distance, which is what a station needs: knowing where to go without stopping to read. They do the same job here, the colour arrives before the label. Manrope across the whole interface.
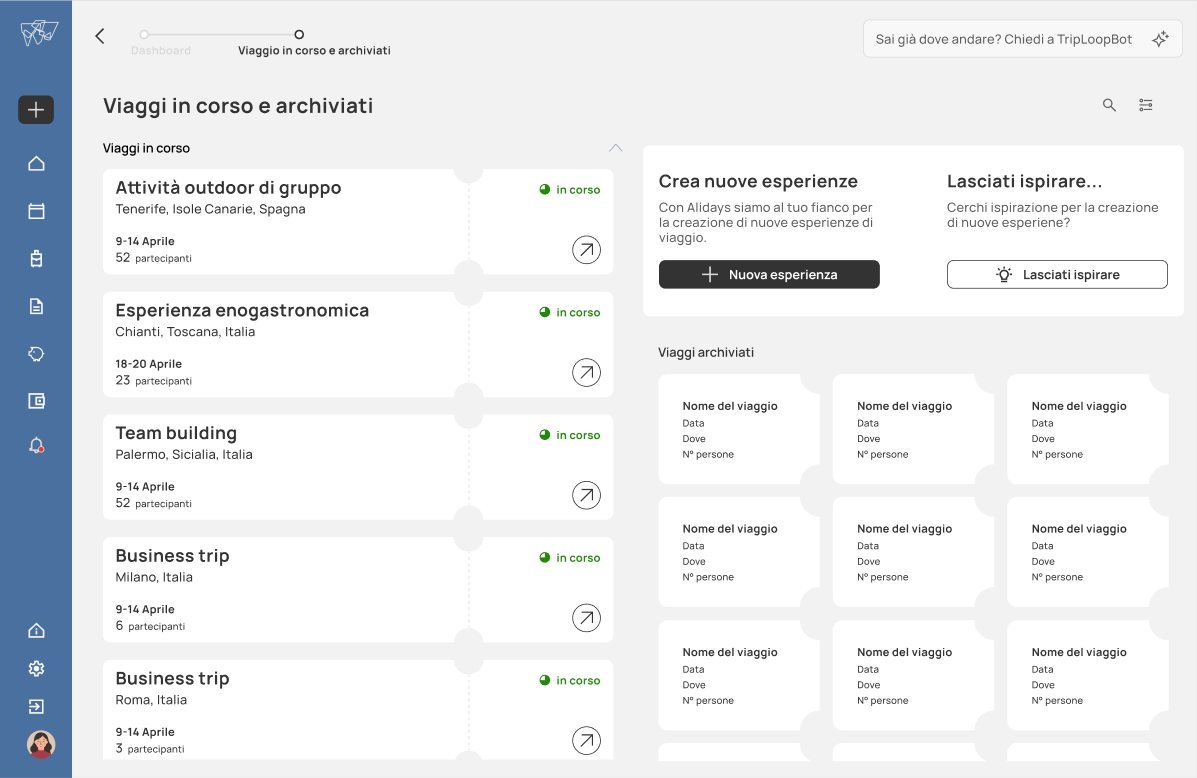
The only card drawn from scratch is a ticket. Whole for the trips ahead, torn for the archived ones.
The trip’s status sits in the shape of the object, so you neither remember it nor read it. Tearing is a gesture the user knows from the physical world. And a work trip is often team bonding too: the stub left in a pocket says that trip happened. Building it taught me Figma features I had not used.
Hover a service and it fills with its colour.
I handled the prototype’s micro-animations. Short, tied to the transport colour code, and built to recall a metro line: the button opens the way a route extends.
One user, no changes.
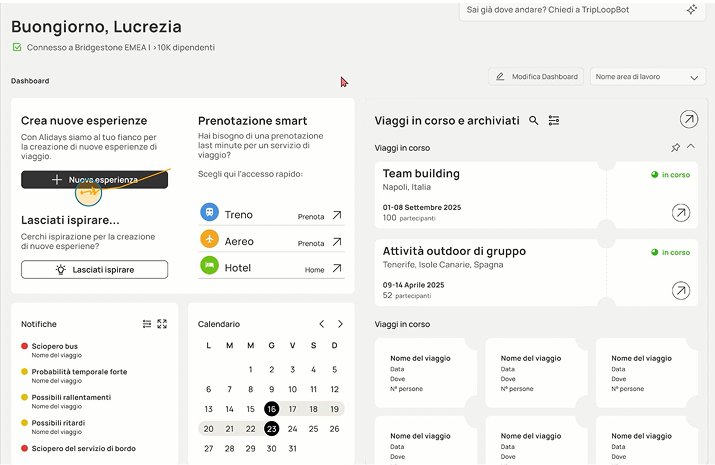
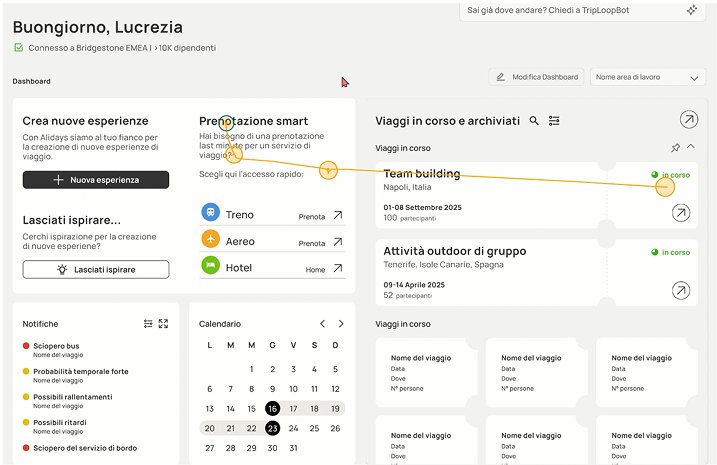
Eye-tracking test with one person. The equipment belonged to the course; I gave the tasks and asked the questions. We had predicted a precise order: the black new-experience button first, then quick booking by service, then the trips in progress and the past ones. The gaze followed that order, so we changed nothing. In my thesis I had designed a protocol around that same instrument, so I knew what to measure.
Alidays
for Creators
UX design
A platform where travel creators pitch trips to Alidays and their followers book them.
A real brief from the tour operator partnered with the course. Collaborative work, everyone on everything; I led the research: netnography, participant sourcing, interviews.
I was wrong.
I thought a tour operator and a travel creator had nothing in common. Netnography and interviews said otherwise, and I found the common ground in reviews: for anyone who lives off an audience, perception is worth as much as the product. The creator cannot afford to recommend a bad trip, Alidays lives on trips people remember. They sell the same thing, the credibility of whoever promises it will be memorable.
“We are at the mercy of the algorithm.”
The creator loses reach without posting constantly, and does not know the rules the algorithm rewards them by. Brands often pay in products, sometimes at ninety days. Travelling alone, they organise everything themselves. The platform gives them a scheduled collaboration, with dates and fees agreed before departure.
Silvia
30–35. She has a main job, travel blogging is the second one. Built as a course exercise, she stayed at the centre of the project.
“I’d like to focus on the quality of the content, but without consistency the algorithm cuts me out.”
Wants
- Authentic, local destinations
- Growing the community with real advice
- Getting better at photo and video
Held back by
- The algorithm, unless she posts constantly
- Collaborations paid in products
- The logistics of travelling alone
The creator proposes, then builds.
Two routes were open: a running conversation with an Alidays contact, or a proposal that travels on its own. We chose the second. The creator uploads the trip, an Alidays employee reviews it asynchronously, and the document changes many times before approval. Then the creator leaves on a trial trip, checks that it holds up, and only then does the package go on sale.
Why it pays for both.
Alidays gets packages it would not have built alone, and the creator’s followers booking them. The creator gets a pilot trip, covered in full or in part depending on the contract, and the content to publish on the way back.
We took the patterns from Notion, Airbnb and WeRoad.
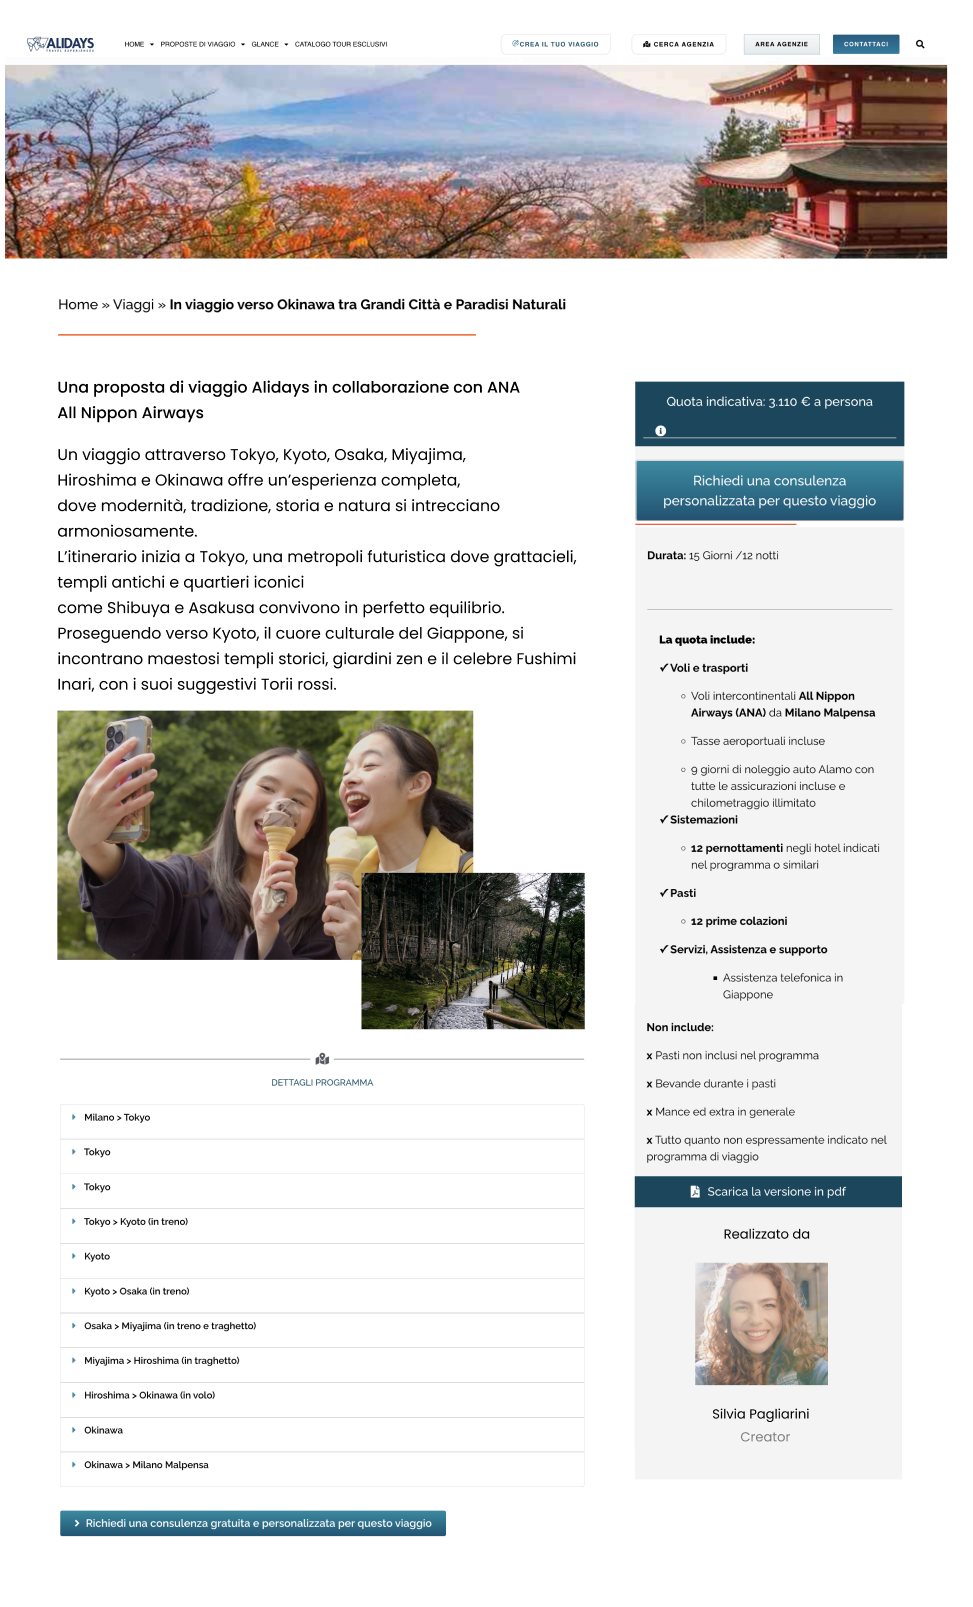
Silvia comes to the product with deadlines and content to produce. Every new pattern she has to learn is time taken from her work, so we used patterns she already knows. WeRoad for the group trip, Airbnb for the stay, Notion for a document that keeps changing.
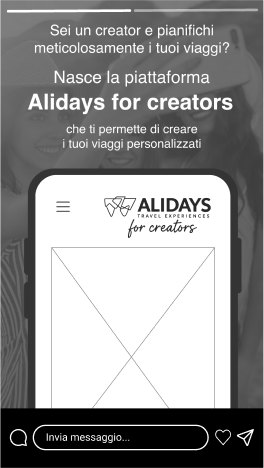
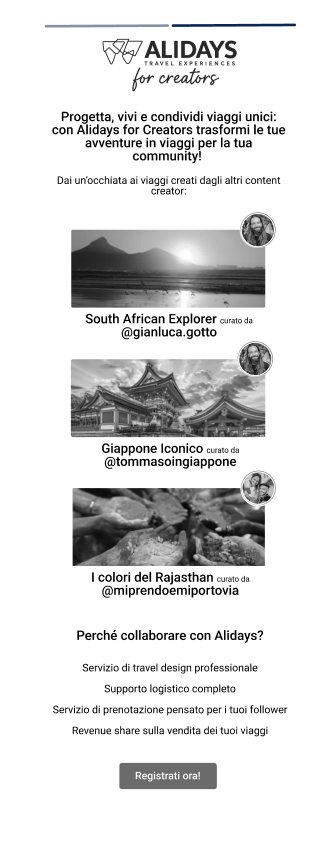
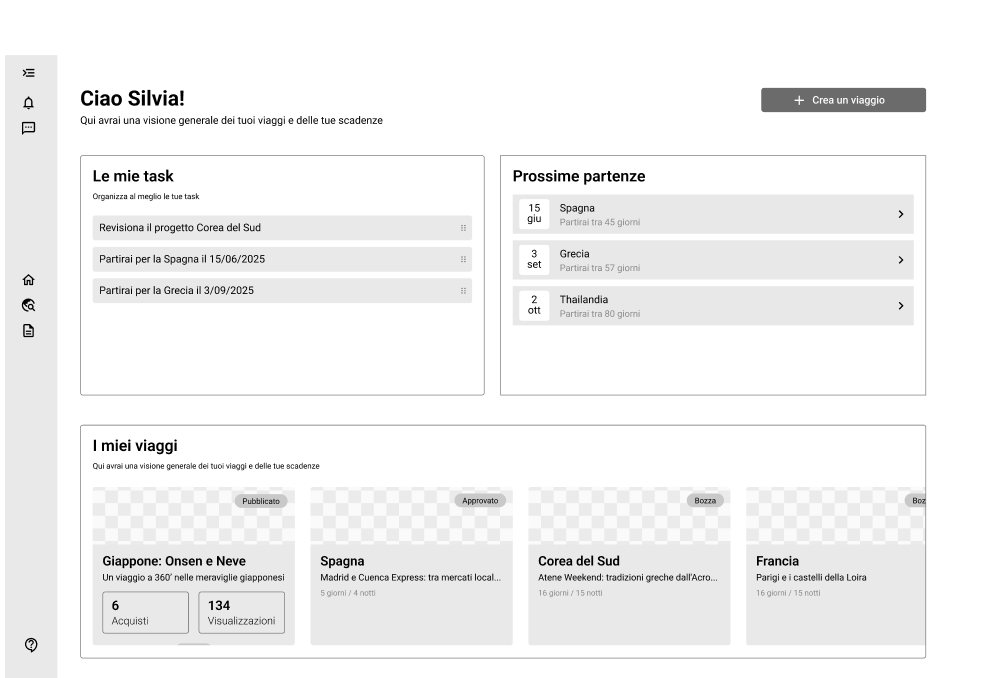
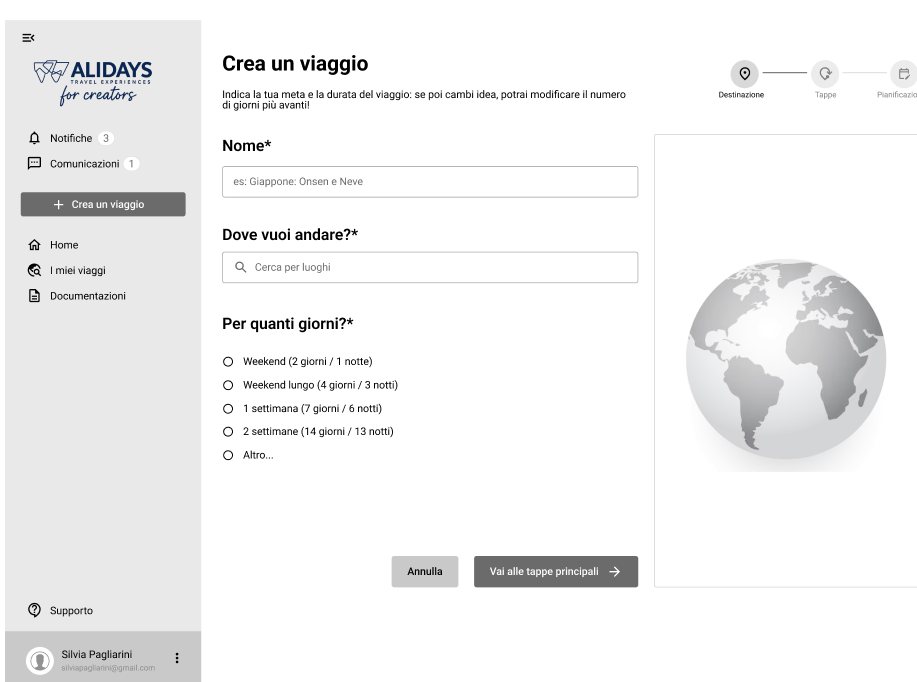
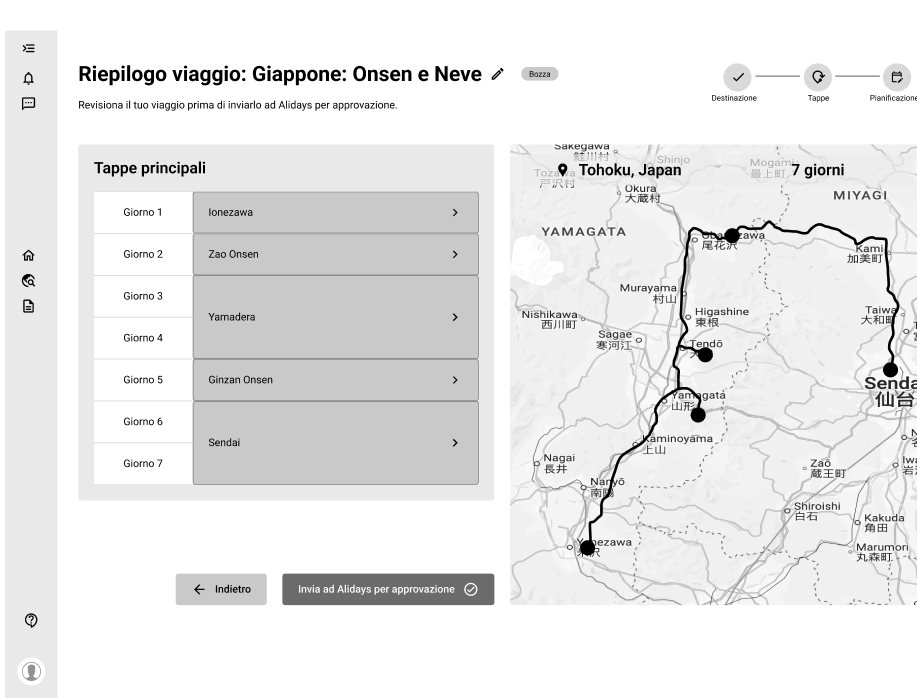
The usability test asked us to simplify. The calendar did not allow it.
The prototype test pointed to screens that needed to be less technical. We could not get those changes into the final design: the course ended there.
With U
Product designA self-monitoring app for people in treatment for depression. The guide is an AI, with clear limits.
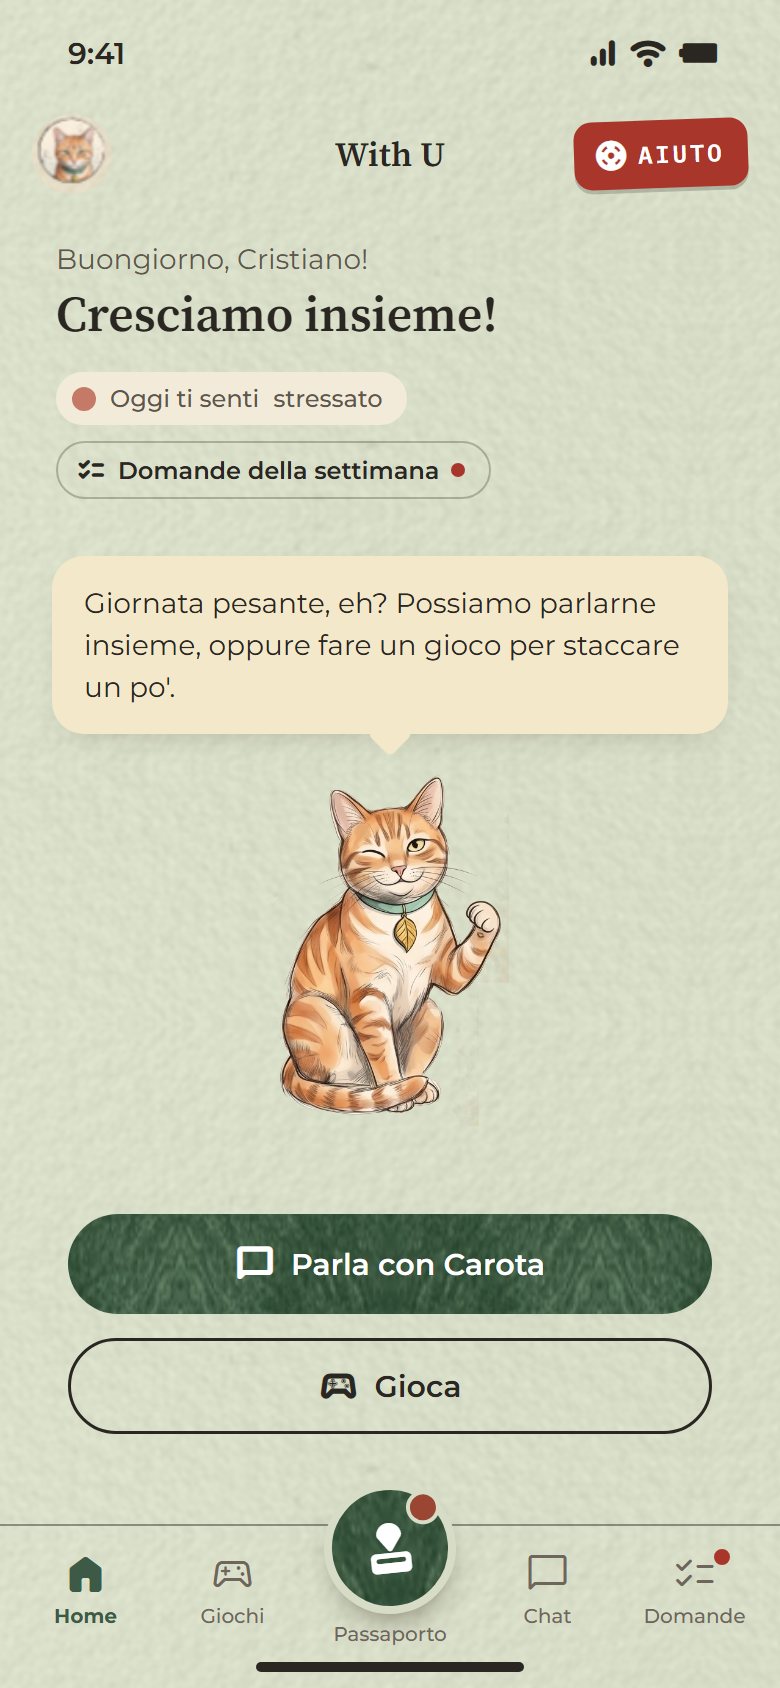
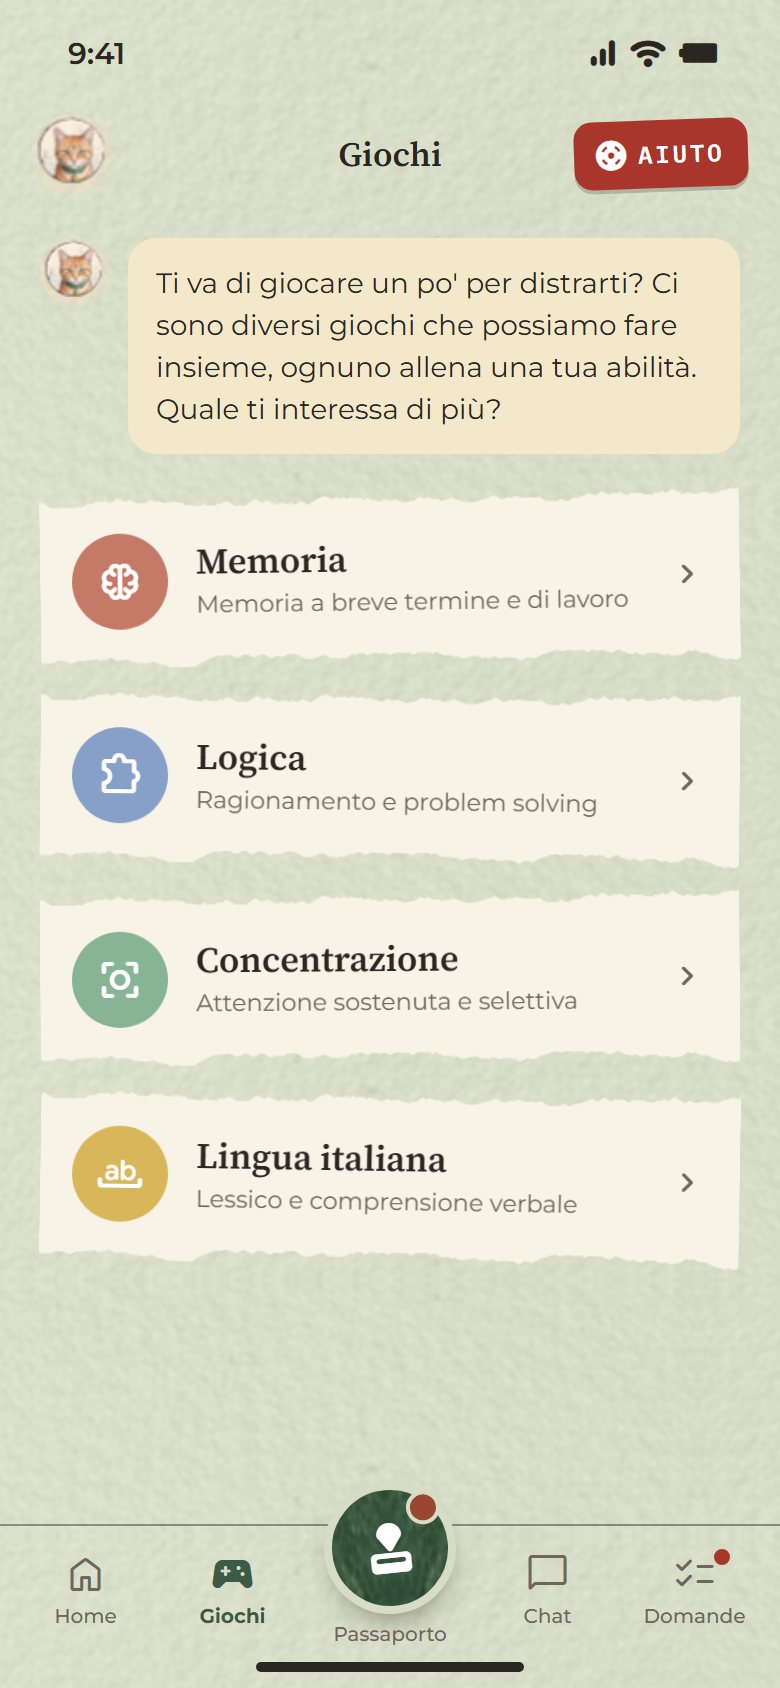
It does not replace therapy: it keeps company with people who already have a therapist. Every day it asks how you feel, answers what you write and has you put a stamp in your passport. I did the UX and the UI: I drew the flows and the interface in Figma, then wrote the front-end code, ready for production.
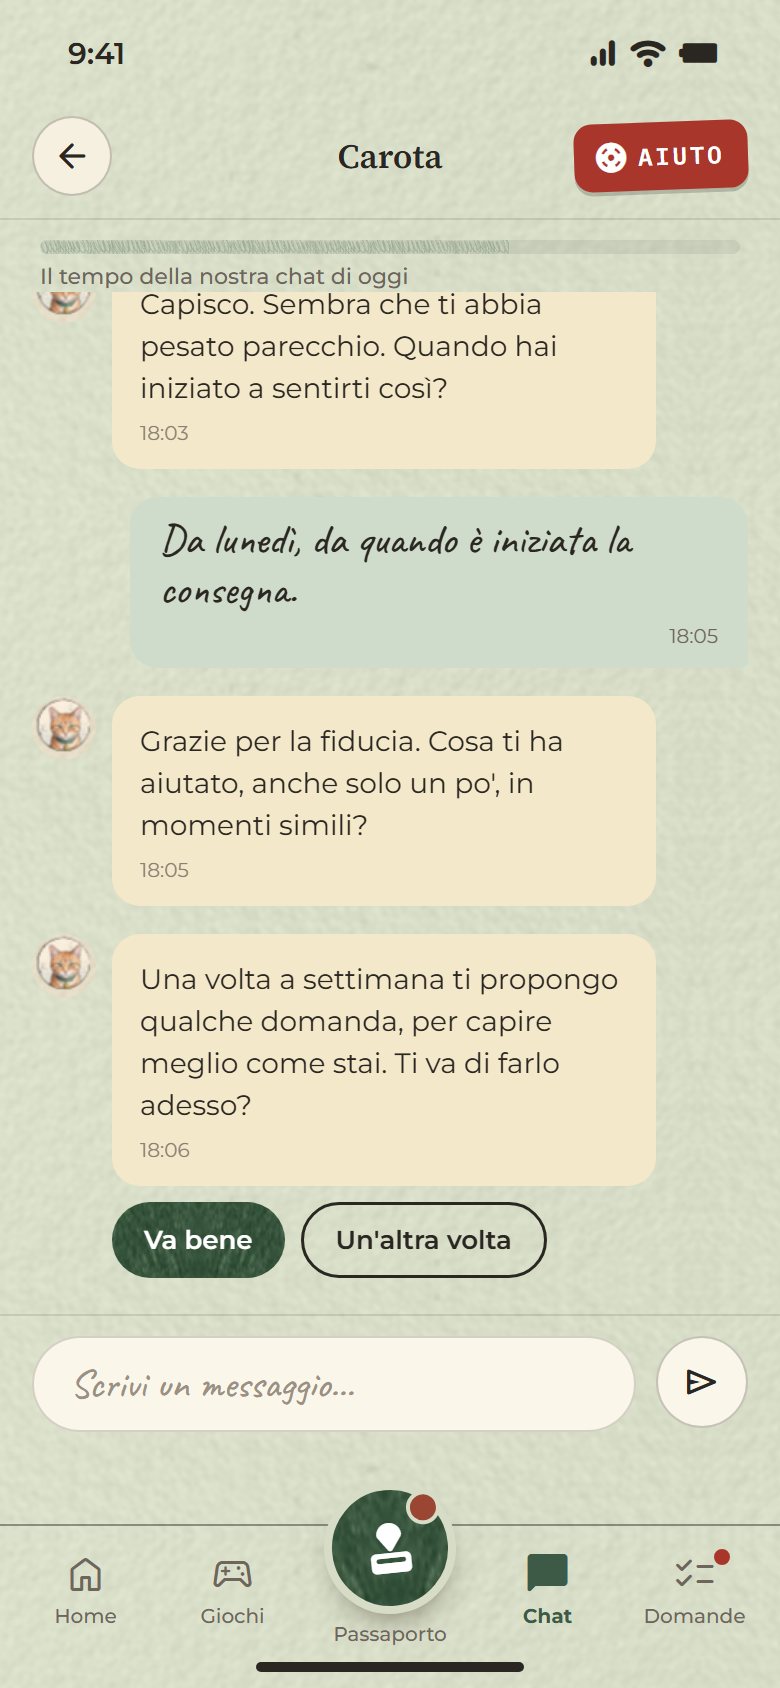
The AI answers the journal, and knows when to stop.
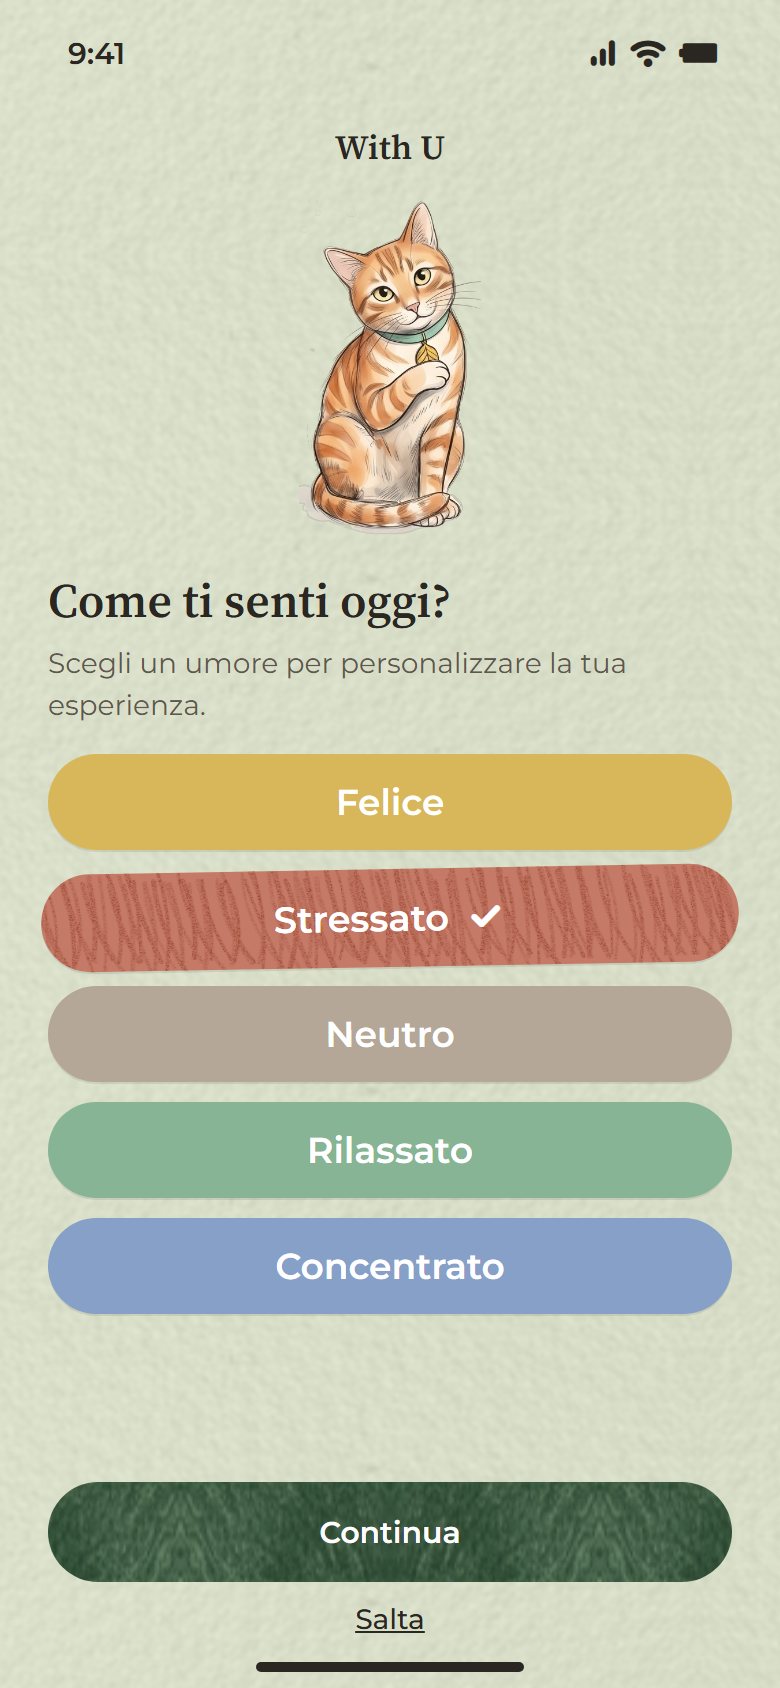
Carota is an orange cat, and the voice of the AI. It asks how you feel, reads what you write and answers with a question. The chat lasts five minutes a day and a bar shows the time left: when it runs out, Carota says goodbye until tomorrow. The games close too, after four minutes or five rounds. The day ends on a screen that says “That’s all for today”.
The therapist is always one tap away.
The Help button is on every screen. It opens four routes: call your therapist or let them know, ask for a call back from a psychologist within 24 hours, a helpline, 112. Once a week Carota offers nine questions; if the answers are worrying, it suggests talking to a specialist. From the profile you can share your progress with your therapist.
Four pastel palettes, chosen not to stir emotions.
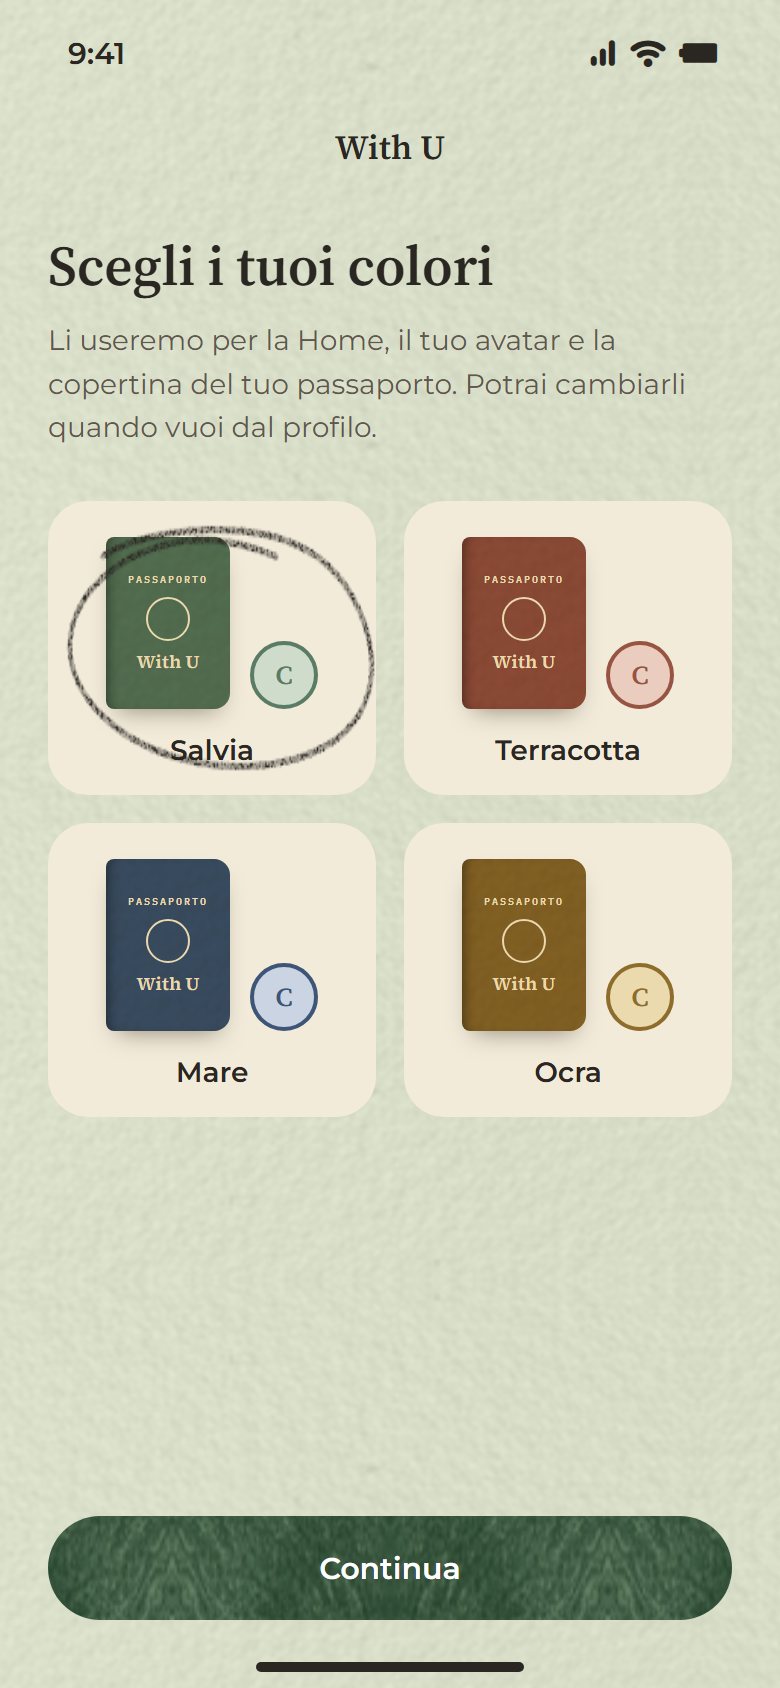
The interface comes in four soft palettes, and the person using the app picks one: Sage, Terracotta, Sea, Ochre. They are pastel because they are not emotionally activating. I made this kind of choice all the way through the design.
One stamp a day, without words.
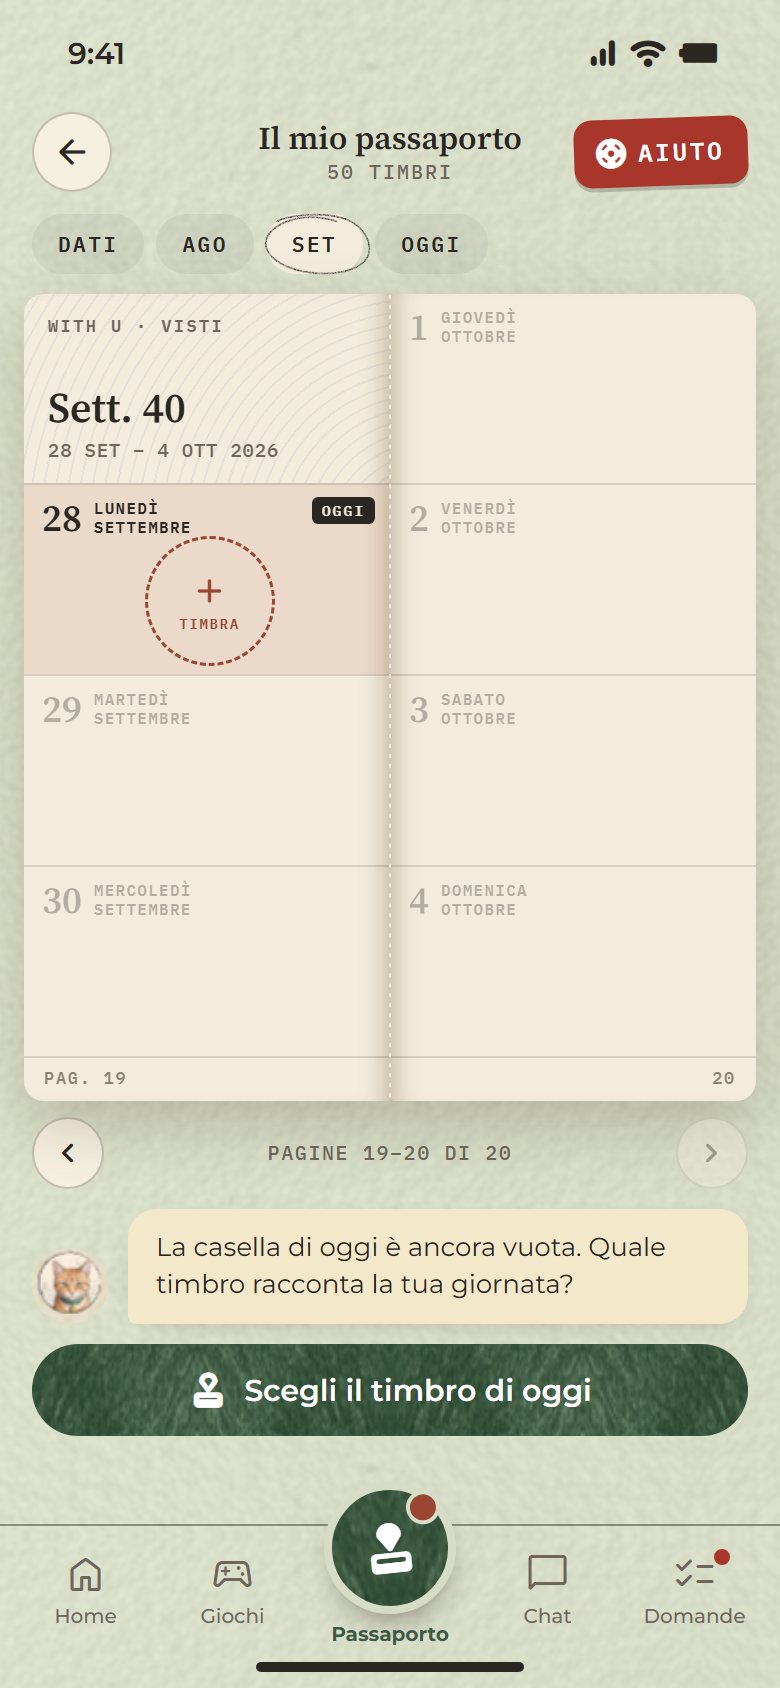
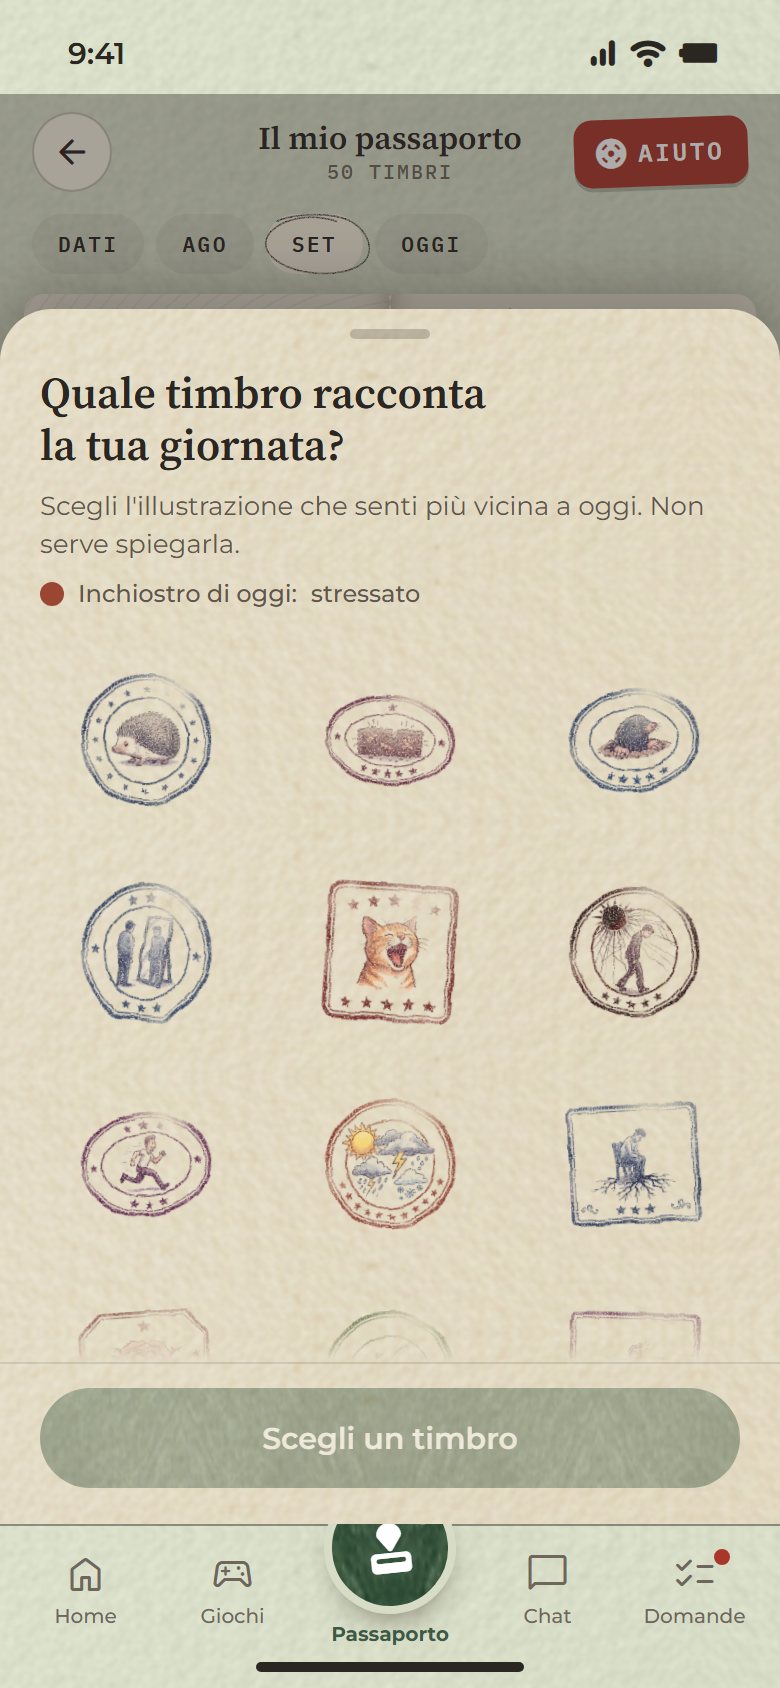
You put one stamp a day in the passport. The stamps are images only: no text and no direct link to a state of mind, precisely so they do not influence the mood of the person filling it in. You pick the illustration that feels closest to your day, without having to explain it.
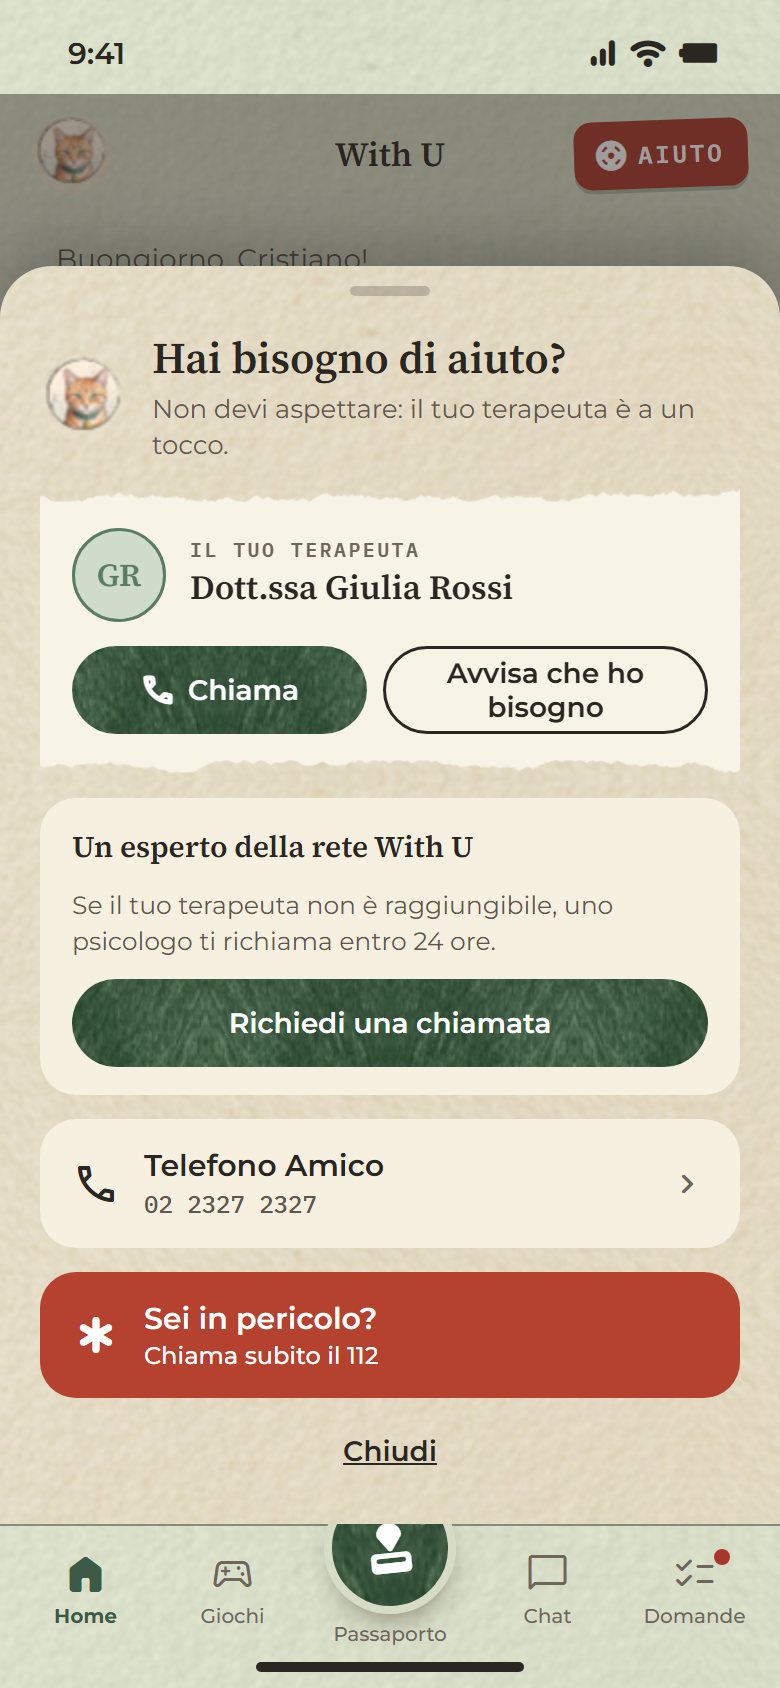
The tests changed the passport.
I tried the app with a small group, through usability tests and interviews. Two changes came out of it: I changed how you interact with the passport and softened the visual style.
You pick up the stamp and carry it to the page.
Once you have chosen the illustration, you pick up the stamp and drag it onto the passport. When it is over today’s box the box lights up; you let go and the print stays, in the ink of the day’s mood.
ADHD: All Deeds
Are Done
UX/UI design
A task tracker for people with ADHD. The things to do are a deck of cards.
It is built for decision paralysis and cognitive overload: when there are too many things to do, a person with ADHD can freeze, and a classic to-do list fails. Here you draw one card at a time. I designed it end to end in Figma: user flows, wireframes, high-fidelity UI and an interactive prototype.
One card at a time.
You draw, and there is one thing in front of you. Swipe right and you do it, swipe left and you discard it and another comes up. A discarded card does not go back to the bottom of the deck: when you reach the last one, you have to do it.
A physical gesture, and a bit of chance.
The swipe is a more physical interaction than ticking a line on a list. And the card is drawn at random from the list you entered: not knowing which chore comes next gives a small dose of dopamine, from novelty and unpredictability.
The timer works the same way.
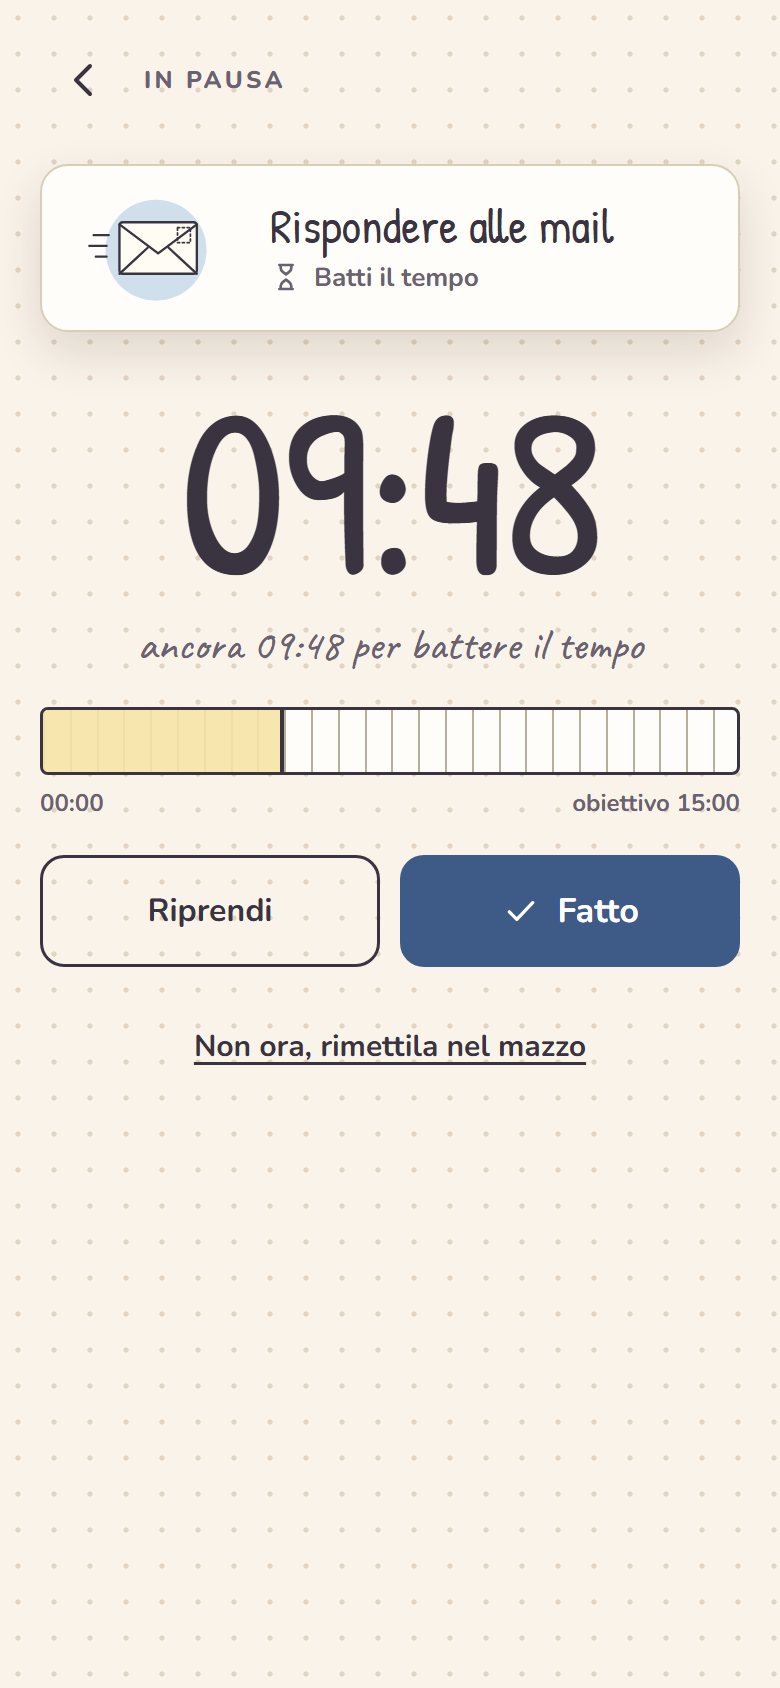
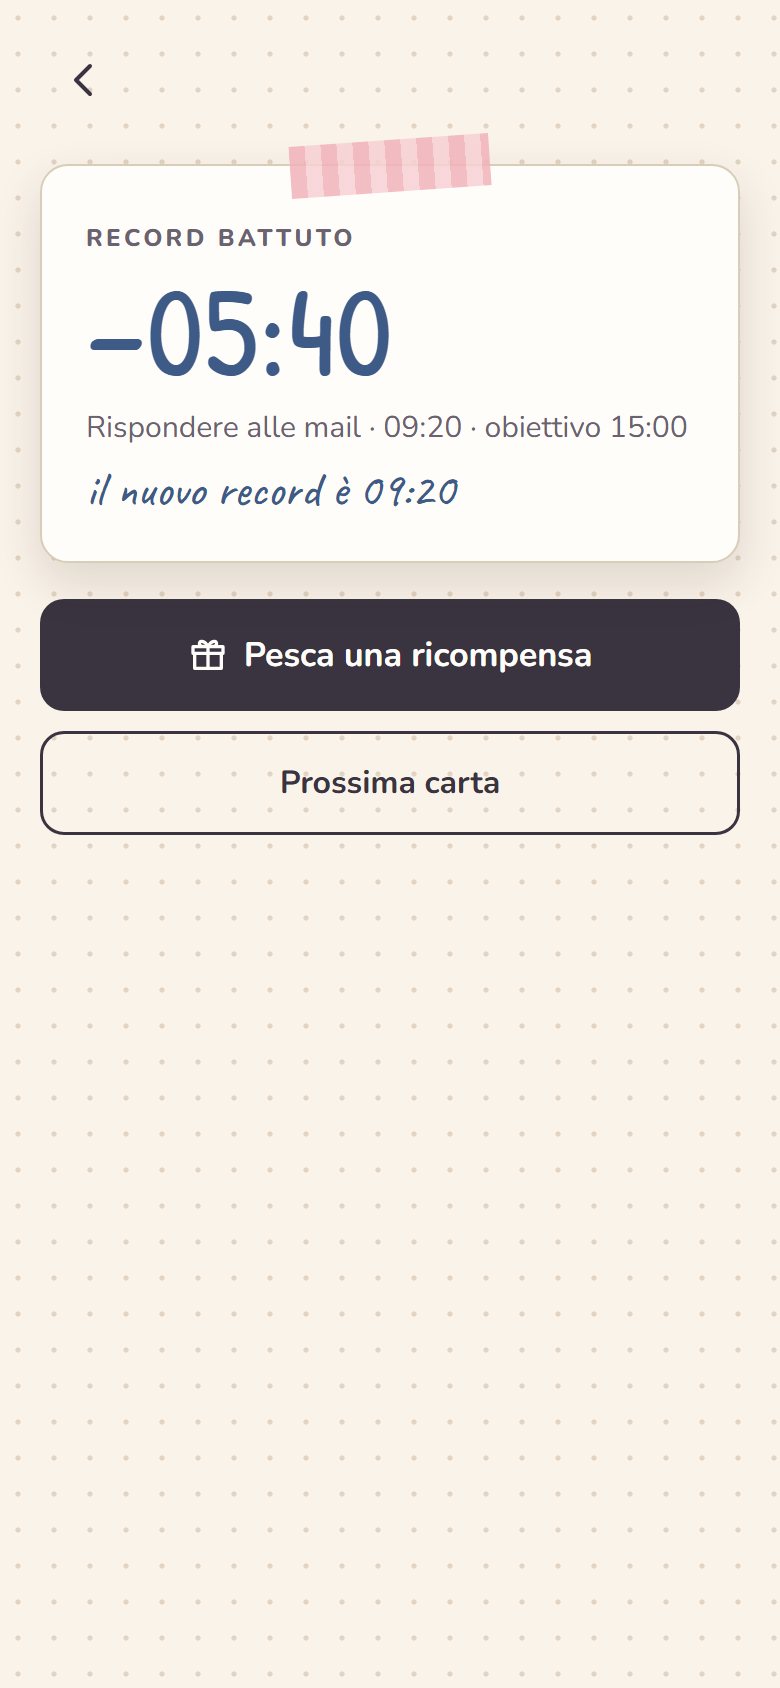
Each card is done with a stopwatch or in “Beat the time” mode. The first time you record becomes the record, and next time you try to beat it: the same chore becomes a new challenge. If the time runs out nothing happens: the timer goes into extra time and tells you to finish calmly.
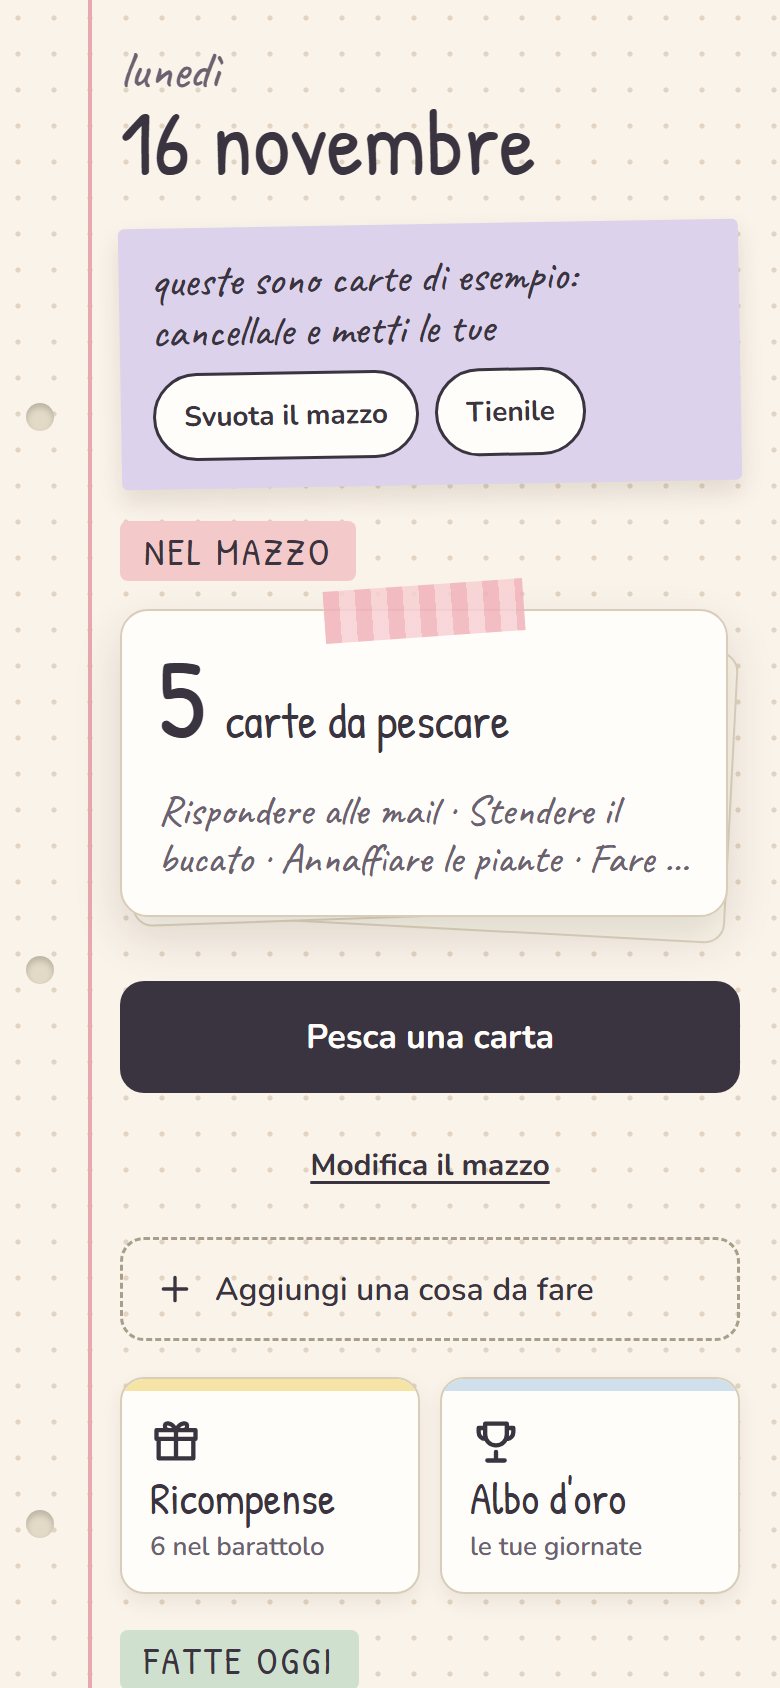
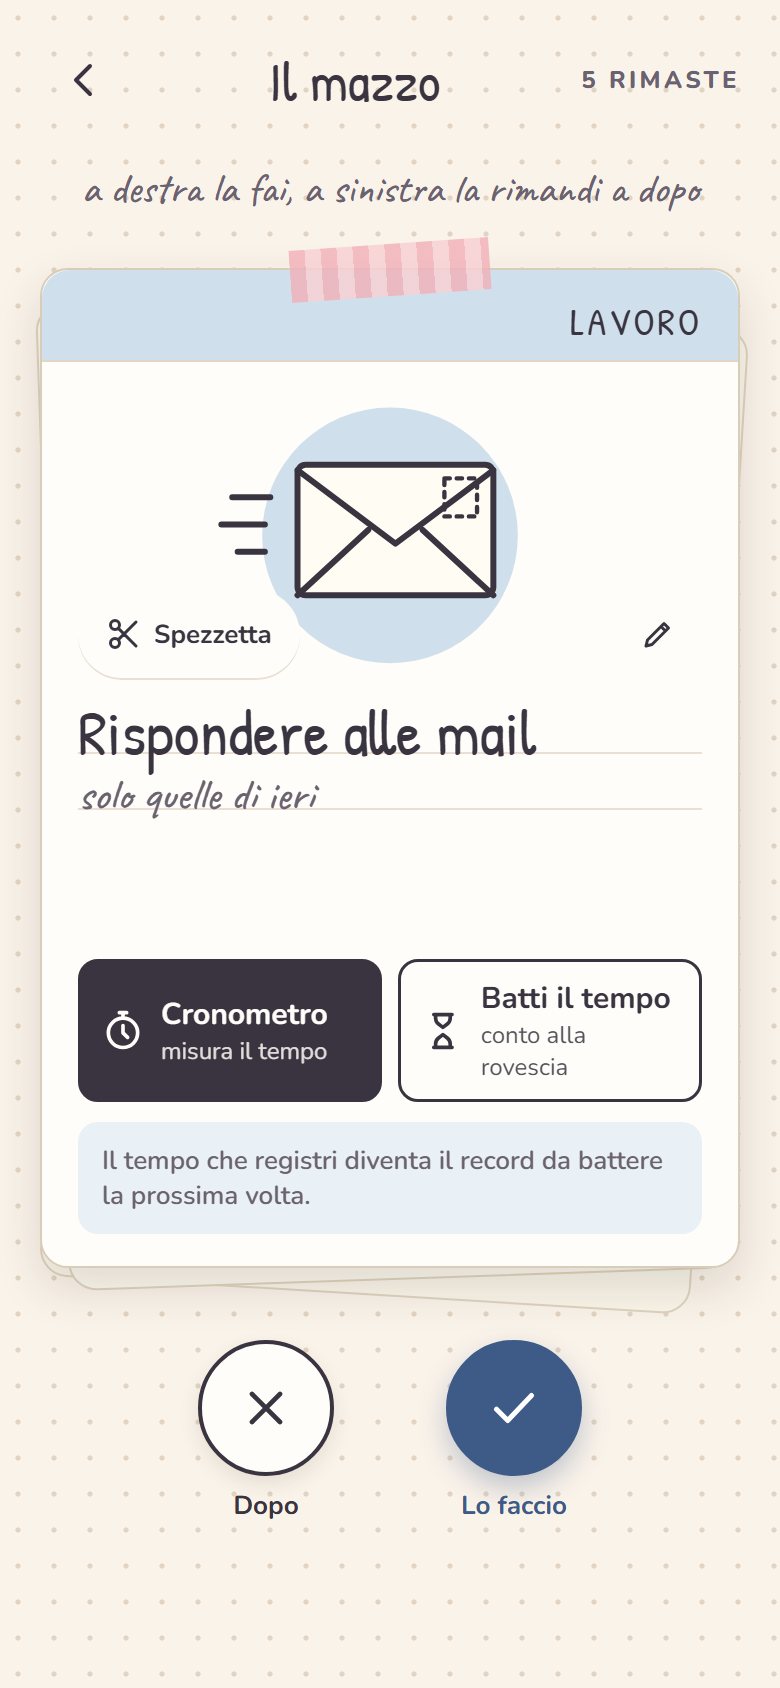
People did not understand the rewards button.
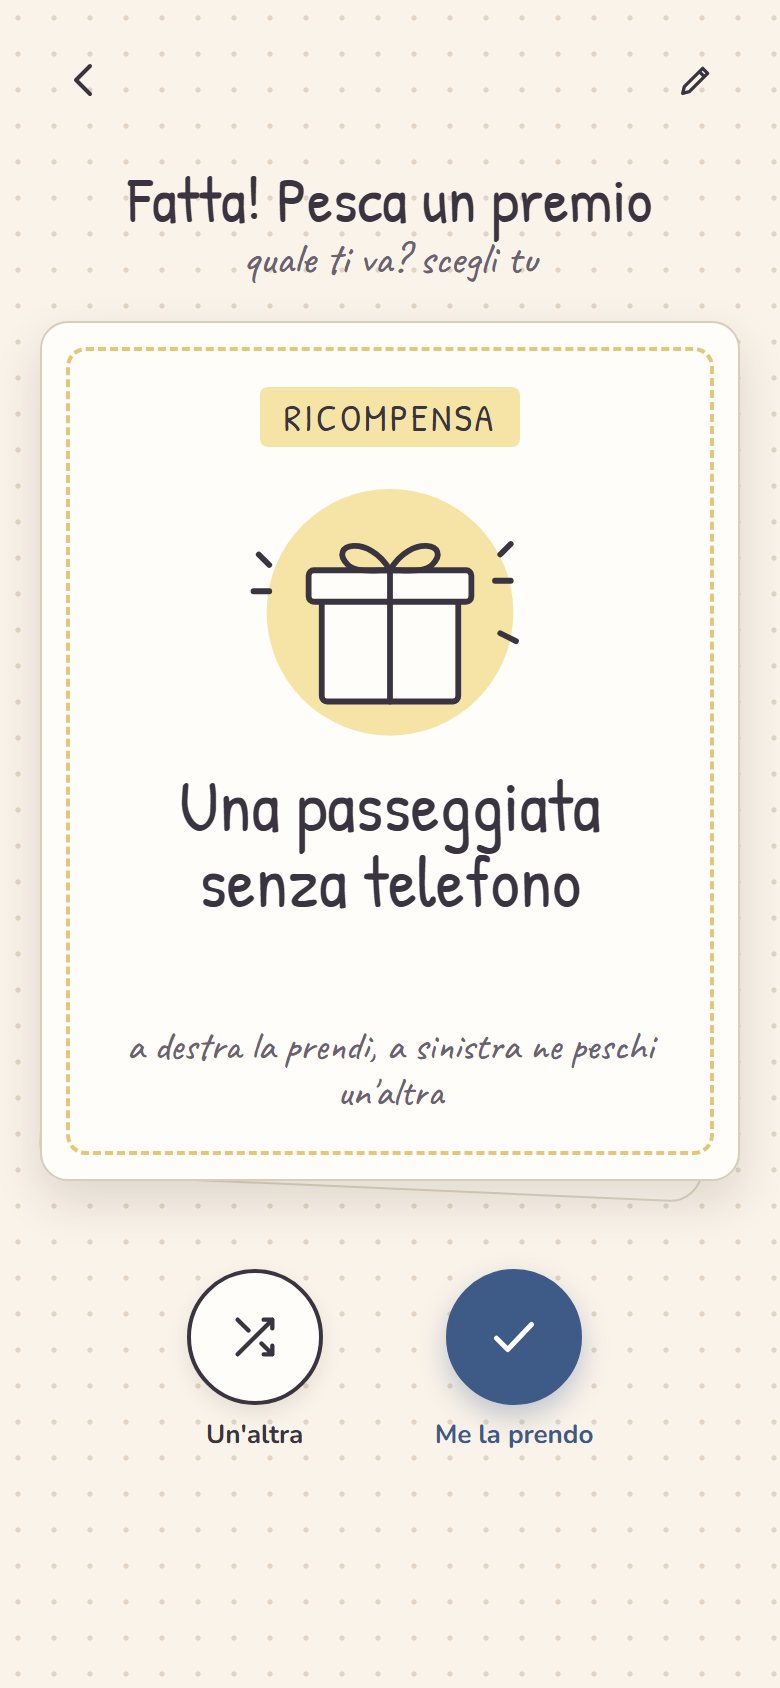
After a card is done you draw a reward, written by the person using the app. At first the rewards deck sat in the top right corner, as an icon button with no label. In the usability tests and interviews with a small group, people did not read it as the rewards deck. I moved it to the home screen, as a larger button.
Five years between psychology and design.
Cognitive ergonomics studies how people use objects. Interfaces are objects. The visual side I learned afterwards, on an executive course and on the job.
- Traineeship in Product Management, Requirements EngineeringECHA, Helsinki03-08/2026
- Mapping for the “Bosco di Oz” project, freelanceAPS Lapsus04-05/2026
- UX/UI Designer, including pro-bonoIndependent projectssince 04/2025
- Teaching assistant, cognitive artifact designSuor Orsola Benincasa10/2024-02/2026
- Traineeship in Interaction Engineering, automotive HMIRe:Lab10/2022-03/2023
- Executive course in UX and UI DesignPOLI.design03-06/2025
- Apple Developer Academy2023-2024Federico II University
- M.Sc. in Psychology: cognitive ergonomics. 110/110 cum laude. Thesis in Interaction Design on the driver’s cognitive loadSuor Orsola Benincasa2021-2024
- B.Sc. in Psychological Sciences and TechniquesFederico II2016-2020
This page isn’t here.
The link may be wrong, or the page has moved. The work and the path are one click away.